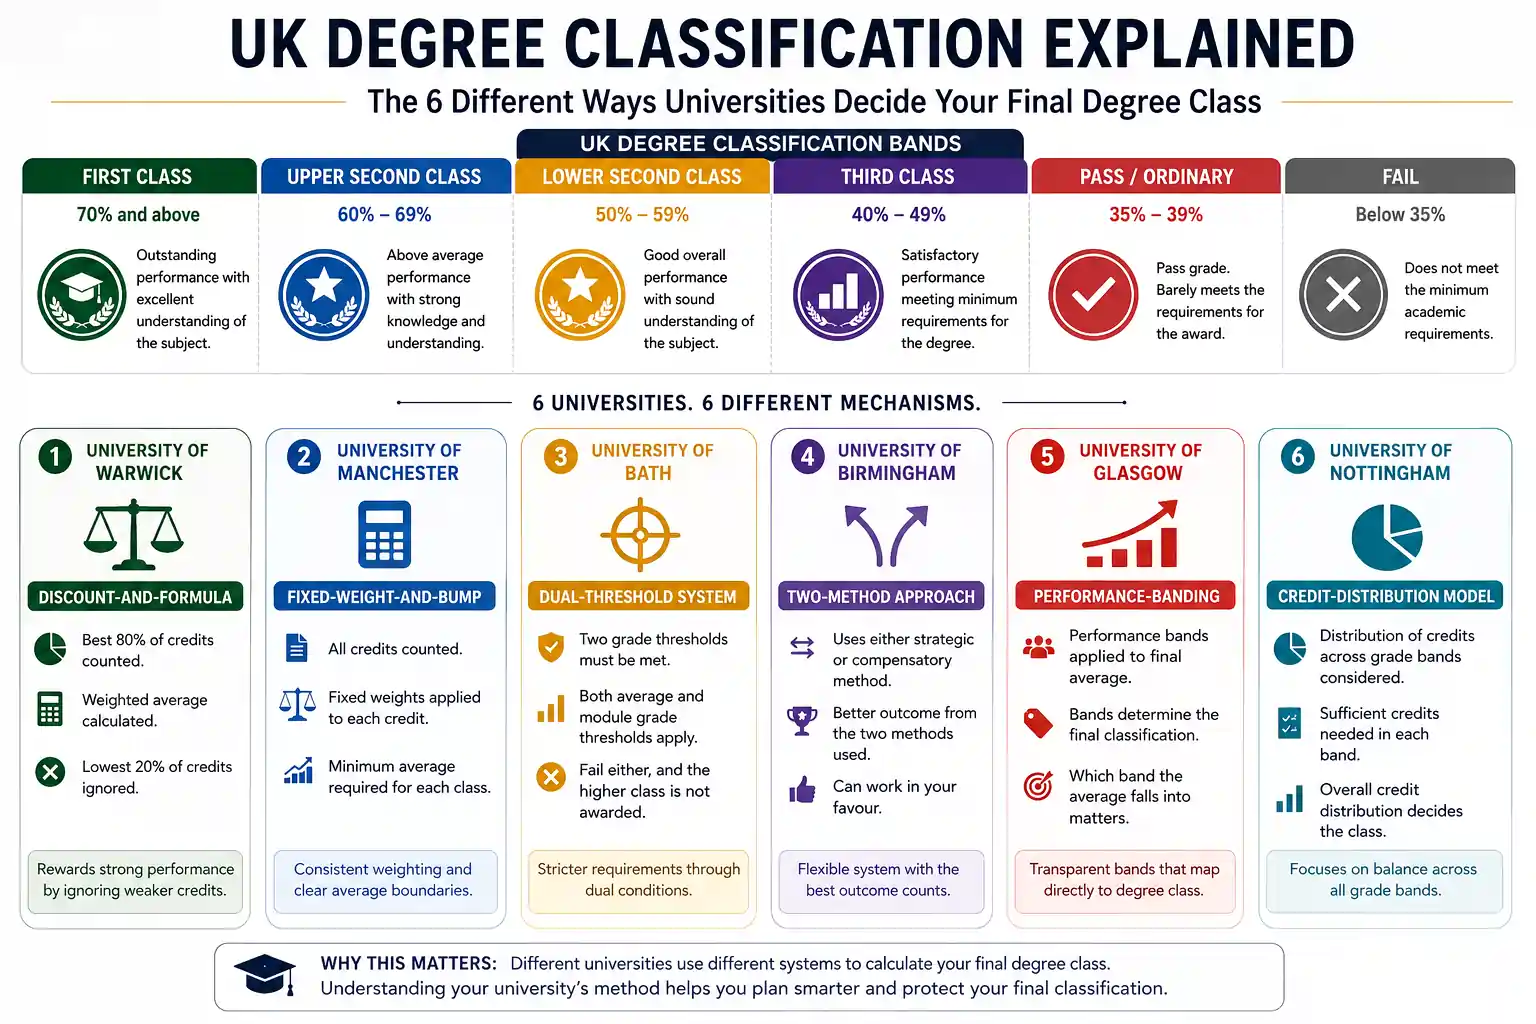
This guide covers the standard bands, then shows how differently six real universities actually get you there.
The standard UK classification bands
Across almost all UK universities, the headline bands are the same: First-Class Honours at 70% and above, Upper Second (2:1) at 60–69%, Lower Second (2:2) at 50–59%, and Third Class at 40–49%.
If you just want to convert a percentage into a classification using this standard scale, the degree classification calculator does that directly and explains why a UK 70% isn't comparable to a 70% in other grading systems.
Six real examples of how the mechanics actually differ
The headline bands above are close to universal. What isn't universal is how a university gets from your individual module marks to that final percentage, and the difference can genuinely change someone's classification, not just the arithmetic along the way.
- University of Portsmouth discounts your worst 20 credits at each of Level 5 and Level 6, then calculates three separate formulae and awards whichever gives the highest classification, including a "Level 6 alone" formula that can rescue a result a straight average wouldn't. See the Portsmouth calculator →
- University of Leeds uses a fixed 1:2 weighting between Year 2 and Year 3, plus an automatic rule: if your result falls within 0.5 marks of the boundary above, you're bumped up to it with no appeal needed. See the Leeds calculator →
- The University of Exeter offers two separate routes to each classification: a straightforward percentage threshold or a slightly lower threshold combined with at least half your credits individually clearing the band above. See the Exeter calculator →
- Sheffield Hallam University runs two methods (a weighted Level 5/6 blend and Level 6 alone) and awards whichever is higher, with a separate borderline rule for results just under the First-Class line. See the Sheffield Hallam calculator →
- Swansea University sorts your credits into performance-based bands rather than weighting by year at all; your best Level 5 work can end up weighted more heavily than your weaker Level 6 modules. See the Swansea calculator →
- Middlesex University doesn't average marks for classification purposes at all; it checks what proportion of your credit falls into each grade band across two different credit profiles and awards whichever profile gives the better result. See the Middlesex calculator →
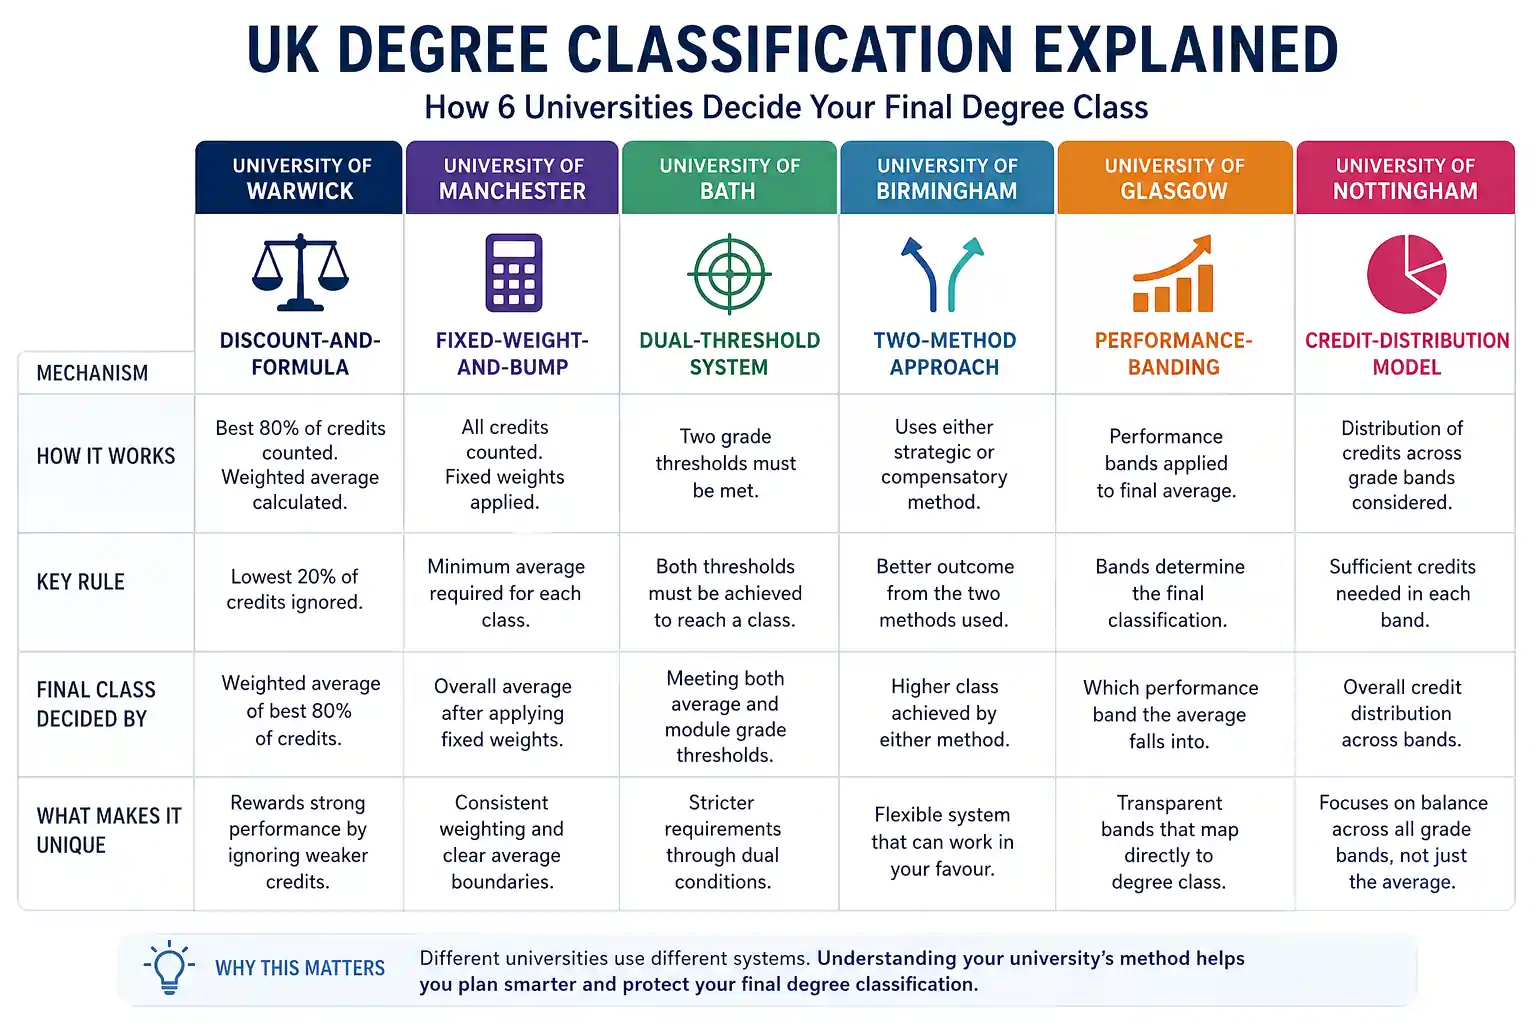
The pattern underneath all six
Despite using six genuinely different formulas, every one of these universities has some mechanism that protects a borderline result using the spread of your individual module marks, not just your headline average.
Portsmouth's credit-majority formula, Leeds' 0.5-mark bump, Exeter's credit-majority threshold, Sheffield Hallam's borderline-credit rule, and Middlesex's entire credit-distribution system are all different implementations of the same underlying idea: a university doesn't want one or two weak modules, or one or two strong ones, to single-handedly decide your classification.
If your own university isn't one of the six above, it's worth checking your own assessment regulations for an equivalent rule before assuming your raw average is the final word.
What this means if you're trying to estimate your own classification
If we've built a calculator for your specific university, use that one — it reflects your institution's actual rules rather than a generic average. If we haven't yet, the degree classification calculator gives you the standard-bands estimate, but treat a result close to a boundary as exactly that: close, not confirmed, until you've checked your own university's specific borderline rules.
Does the classification mechanism actually matter after graduation?
Once you've graduated, what appears on your transcript and certificate is the final classification itself — First, 2:1, 2:2, or Third — not the formula that produced it. An employer or postgraduate admissions team generally won't see whether you got there via a straightforward average, a credit-discount formula, or a banding system; they see the classification.
Where the mechanism matters is while you're still studying, when you're trying to work out where you actually stand and what you need from what's left, which is exactly why a calculator built around your specific university's real rules is more useful at that stage than a generic average.
Frequently asked questions
Is a 2:1 a good degree?
Yes — a 2:1 is generally considered a strong result and meets the minimum requirement for most graduate jobs and postgraduate courses in the UK. A First is less common and typically signals exceptional performance, but a 2:1 is not a disappointing outcome by any normal standard.
Does every UK university use the same classification boundaries?
The headline percentage bands (70/60/50/40) are close to universal, but how a university calculates the percentage that gets compared to those bands — and how it handles borderline cases — varies significantly, as the six examples above show.
What if my university isn't one of the six listed here?
Use the degree classification calculator for a standard-bands estimate, and check your own university's assessment regulations or course handbook for any borderline or credit-distribution rules specific to your institution.
Why do some universities discount your worst credits and others don't?
There's no single UK-wide standard; each university sets its own assessment regulations, subject to general higher-education quality frameworks. The six examples above show genuinely different approaches that have each been independently adopted and published by that institution.
Why bother building a calculator for each university instead of one generic tool?
Because, as the six examples above show, the actual mechanics genuinely differ enough to change someone's result — a generic average can tell you roughly where you stand, but it can miss a rule that would have given you a better (or worse) classification at your specific institution.